Power Query in Power BI Course in Coimbatore
Mastering Power Query in Power BI is essential for transforming, cleansing and loading data and at Xplore IT Corp, we provide the ultimate destination for achieving this expertise through our advanced Power Query course. Power Query in Power BI forms the backbone of creating dynamic data models, insightful reports and dashboards, offering comprehensive coverage of basics and advanced transformations for handling complex datasets. Our Power Query course equips data analysts and business professionals with practical skills to streamline workflows, manipulate data effectively and enhance analysis capabilities. Guided by expert trainers, you’ll engage in hands-on project work and practical exercises to gain proficiency in Power Query in Power BI. Whether you’re a novice or an experienced individual, this Power Query course ensures your ability to leverage Power BI for data management. Empower your data-driven career aspirations and elevate your role with the essential knowledge and tools provided in our Power Query course at Xplore IT Corp.
Key Features
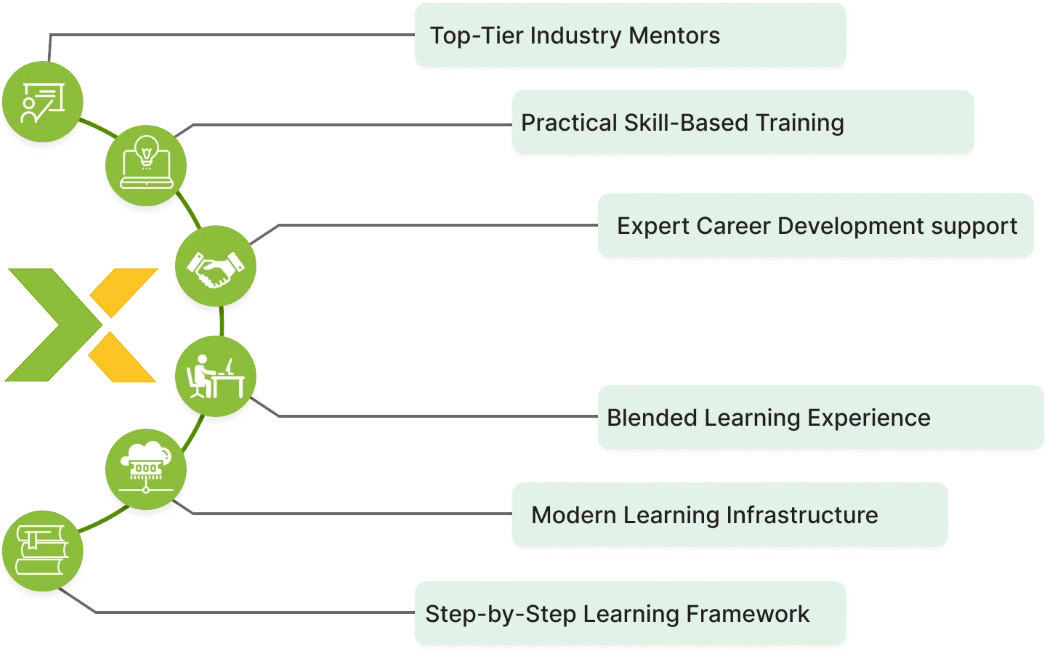
Highlights of Xplore IT Corp Power Query Course
Full Course Content
The Power Query Course dives into the essentials of Power Query basics making sure you get the main ideas. We guide you through each step of pulling out data, changing it and loading it back.
Actual Practice
We're all about doing stuff for real at Xplore IT Corp. The Course helps you to work into actual datasets from the real world, so you can get practiced using Power Query.
Pro Instructors
Get your knowledge from pros who've seen it all in Power Query . Our instructors share big insights on how to shift data around.
Interactive Sessions
You get to interact a lot in our classes. Students can ask all the questions they need about Power Query and clear up any confusion.
Certification and Support
Once you're done with the Course, you get this certificate that can help you take your data analytics career to the next level.
Real-world Applications
In our Course, we use real-world examples to show you how Power Query I works across various sectors.
Power Query Course Objectives
Learn the basics of Power Query , including its interface and features for data transformation.
Understanding Power query
Understanding cleaning up data in Power Query. This includes kicking out any copies and dealing with data that’s gone missing.
Data Cleaning Techniques
Get what it takes to change data with Power Query I. Working with data, you can merge, append and reshape data.
Data Transformation
Dive into some functions in Power Query in Power BI that automate repetitive tasks and improve efficiency.
Advanced Query Functions
Learn to connect various data sources using Power Query , such as databases, spreadsheets and APIs.
Connecting Multiple Data Sources
Here you can use what you’ve learned in actual projects by getting direct practice with Power Query.
Real-World Project Implementation
Benefits of Power Query Course Certification
- Having a Power Query in Power BI certification boosts your resume and job prospects.
- Big shot companies know that if you've got that Power Query certificate, you've got some serious data crunching skills.
- If you're slick with Power Query , you're like gold dust in the job hunt.
- Certified professionals in Power BI earn higher salaries than non-certified individuals.
- Our Course will have you diving in hands-first prepping you to hit the ground running in the real world.
- Dive into a professional circle with skills in Power BI opening doors for your career advancement.
Benefits of Learning Power Query Course at Xplore IT Corp

Industry-Relevant Skills
The Course helps you up with all the critical skills you need for today's world where data runs the show. Power Query is all about helping experts handle and reshape huge amounts of data.

Career Advancement
Getting good at Power Query could score you on stuff like data crunching, business intelligence and messing with data wires.

Hands-on Learning Experience
In our Course, we're all about the real-deal skills. We make sure you're ready to work on Power Query by using it a bunch.

Tailored Help
Our trainers have your back in the Course, making sure all you guys get what Power Query is all about.

Certification for Career Growth
A certification in Power Query in Power BI from Xplore IT Corp enhances your resume and credibility in the job market.

Flexible Learning Options
Our Course provides flexible study times. It's perfect for both working professionals and students.
Syllabus of Power Query Course
- What is Report View
- Basic Visualisation In Power Bl
- Basic Charts in Power Bl
- Formatting of Visuals in Power Bl
- Introduction to Visualize Spatial Data by Maps
- Working with Maps in Power Bl
- Geo Styling
- Formatting of Pages & Reports
- Working with Themes
- Introduction to Analytic Artistry in Power Bl
- Graphical Glory
- Smart Graphs
- Textualize Your Data in Power Bl
- Matrix Mastery
- Conditional Formatting in Textual Data
- Hierarchies in Matrix
- Filters & Slicers in PBI
1. Introduction to Filters
2 Filters on Different Data Types
3 Introduction to Slicers - cards & KPIs in PBI
1. Number Cards
2 Textual cards in PBI - Using Actions to Enhance Data Visualisation
1. Elements in PBI
2 Actions in PBI
3. Bonus in PBI
- Q&A in Power Bl
- Decomposition Tree in PBI
- Smart Narrative in PBI
- Increase & Decrease Feature in PBI
- Get Quick Insights in PBI
- What is Power Bl Service
- Creating an Account in PBI Service
- Publishing the Report to PBI Service
- Sharing & Collaboration of Power BI reports
- Exporting the Report
- Power Bl Service Settings
1. Automatically Refresh PBI Reports - Dashboard in Power Bl
1. Creating a Dashboard in PBI Service
2 Dashboard Options
- Introduction - Microsoft Power Bl
- Introduction - Business Intelligence
- Introduction — Data Visualization
- Components of Power Bl
- Power Bl Desktop
- Introduction - Data Warehouse
- Power Bl — Installation
- Power Bl - Dynamic User Interface
- Power Query Overview
- PQ — Text Functions
- PQ — Date Functions
- PQ — Number Functions
- PQ - conditional columns & CFE
- PQ — Appending or Combining Files
- PQ — Merge Queries
Powerful Cleaning Features
1. Pivoting
2 Unpivoting - Working with Rows & Columns in PQ
- Working with Filters & Parameters
- Custom Function Feature to Clean and Combine Files
- Get SQL Data in Power Bl
- Get Live Website Data in Power BI
- Get Email Data in Power BI
- Get Google Forms(Google Sheets) Data in Power Bl
- Get Power Bl Datasets
- SharePoint in Power Bl
- Get JSON Files in Power Bl
Introduction to Power Pivot & Data Modeling
- Understanding DAX Functions in Power BI
- Date & Text Functions in DAX
- Logical Functions & Calculated Columns vs Measures
- Implicit vs Explicit Measures
- Using CALCULATE, FILTER & SUMMARIZE Functions
- Time Intelligence Functions: PREVIOUSDAY, NEXTDAY, SAMEPERIODLASTYEAR
- MTD, QTD, & YTD Calculations
- Concatenated Lists, Star Ratings & Quick Measures
- Using the CALENDARAUTO Function
- Building & Utilizing Calendar Tables
- Mastering DAX Functions for Business Intelligence
Hands-on Power BI DAX Projects for Skill Application
- Errors
- Exception handling with try
- Handling Multiple Exceptions
- Writing your Exception
- New Style Classes
- Creating Classes
- Constructor
- Instance Methods
- Inheritance
- Polymorphism
- Abstraction
- Encapsulation
- Exception Classes
- List Comprehensions
- Nested List Comprehensions
- Dictionary Comprehensions
- Tuples
- Iterators
- Generators
- With Statement
- Data Comprehension
- Namedtuple()
- Deque
- Chainmap
- Counter
- Dict and Types
- Introduction
- Components and Events
- An Example GUI
- The root Component
- Widgets
- Buttons
- Introduction
- Hello World
- Major Classes
- Using Qt Designer
- Signals & Slots
- Layout Management
- Basic Widgets
- Drag & Drop
- Database Handling
- Introduction DB Connection
- Creating DB Table
- INSERT, READ, UPDATE, DELETE Operations
- COMMIT & ROLLBACK Operation
- Handling Errors
- GUI With Sqlite3
- Desktop Application
- Random
- Turtle
- File Input & Output
- Time & Date etc.
- Split
- Working with Special Characters, Date, Emails
- Quantifiers
- Match and Find all
- Characters sequence and substitute
- Search Method
- Set
- Introduction
- Socket - Introduction
- Clients and Servers
- The Client Program
- The Server Program
- Class and Threads
- Multi-Threading
- Threads Life Cycle
- Use Cases
- Introduction
- Learning Programming
- Core Language
- Text editors and IDEs
- Sublime Text
- PyCharm
- Jupyter Notebook
- Environment Configuration
- Virtual Environments
KIWI-Building Mobile App
Python Web Development With Django
Our Power Query BI Course at Xplore IT Corp Training Institute has been designed with a focus on the in-depth knowledge and practical experience of data analysis and business intelligence. Expert trainers at our institute have great experience working with Power Query, which enables us to guide the participants through the techniques and best practices. Xplore IT Corp ensures that our Power Query BI Course will bring practical skills, which are high in demand by the industry. Whether you’re a beginner or looking to expand your skills, our trainers will help you to unlock the complete potential of Power Query. Take the Power Query BI Course today and transform your career with expert guidance and comprehensive training.

Leading Training Institute
Xplore IT Corp is a trusted name for Power Query in Power BI training, known for delivering quality education and industry-relevant courses.

Experienced Trainers
The people teaching here are real-world pros at Power Query . They make sure you get the education that's top-notch.

Practical-Based Learning
Learning here is about using Power Query for actual stuff you'll do. It keeps things hands-on and interesting.

Career Support
When you finish the Course, they'll help you find a job. They have help to get you where you wanna be.

Affordable Pricing
The Power Query Course we offer is price accessible to students and professionals who can get on board.

Valued Qualification
Our certificate in Power Query in Power BI can add value to your career and might just open doors to new job options.


Placement After Completing Power Query Course

Ready for the Workforce
Our Power Query Course gets you set for work in data analysis and the business intelligence sector.

Crafting Your Resume
We guide our learners to create impressive resumes that showcase their Power Query capabilities

Preparing for Interviews
Training sessions for achieving interviews in Power Query are part of our course.

Real-World Experience
Our students gain practical know-how with internships in Power BI.

Help with Job Hunting
Support in finding employment post the Power Query Course is something we're happy to provide.

Advice for Your Professional Path
Our pros provide tips on advancing careers through Power Query expertise.
Job prospects after graduating from the course
Data Analyst: Analyze and interpret complex data for business insights.
Business Intelligence Developer: Create interactive dashboards and reports.
Data Visualization Specialist:Design visual presentations for decision-making.
Power BI Consultant : Provide expert solutions using Power BI tools.
ETL Developer: Extract, transform, and load data efficiently.
Data Engineer: Build robust data pipelines and processing systems.
We offer a placement course in Power BI, ensuring you have a clear path to employment and continuous support and guidance from our dedicated placement team.
Our In Demand Courses
Frequently Asked Questions
The course lasts around 2–3 months. Flexibility for batches both across weekdays and weekends.
It is better to acquire little knowledge in Power BI, although it is not compulsory
Yes, Xplore IT Corp provides a certificate for course completion.
Yes, we also provide comprehensive placement assistance including job referrals as well as mock interviews.
Through this course completion, you can apply for the positions of a Data Analyst, Business Intelligence Specialist and Power BI Developer.

Reach Us Now!


